

 Need some awesome Google Analytics dashboards to segment your data? Last week I discovered a page on my site took 25.4 seconds to load for visitors in Seattle—embarrassing, but I fixed it using a custom GA dashboard. These dashboards help you identify slow pages, mobile errors, exit points, and more.
1. General Analytics Dashboard
Get an at-a-glance view of your site’s traffic sources and top content.
Metrics:
- Unique visitors
- Visitors by channel: organic, social, referral, direct
- Top non-branded keywords
- Most viewed pages
- Social networks driving traffic
- Referral sites excluding major platforms
Download the General Analytics Dashboard
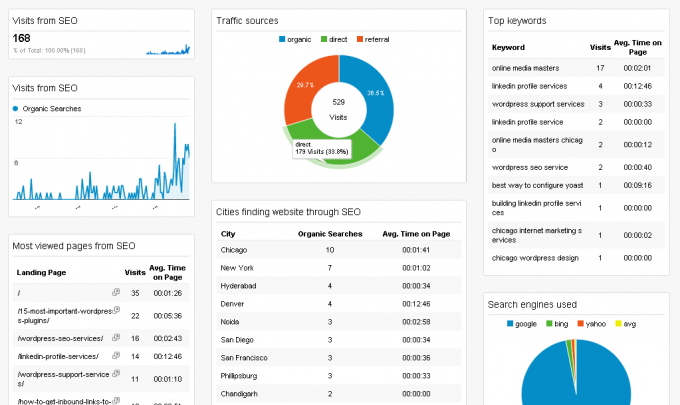
2. SEO Analytics
Analyze organic search traffic, top landing pages, and keyword performance.
Metrics:
- Organic visitors
- Top non-branded keywords
- Local keywords by city
- Service-related keyword performance
- Search engines used: Google, Yahoo, Bing
- Top SEO landing pages
- Cities finding your site through search
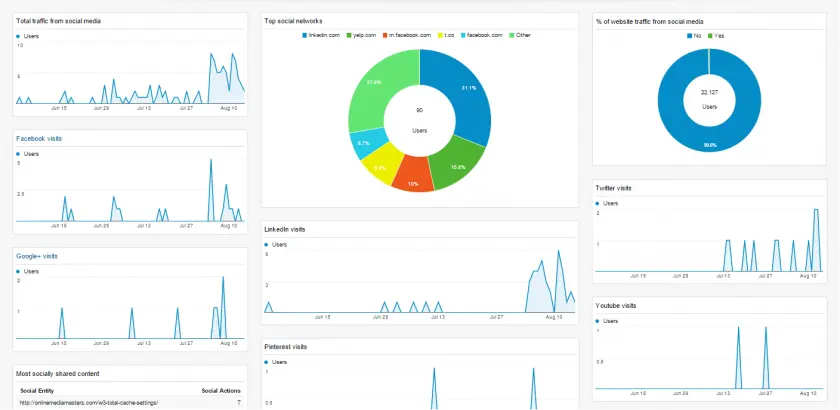
3. Social Media Analytics
See which social platforms drive traffic, most shared content, and visitor locations.
Metrics:
- Visits from each major social network
- Most socially shared pages
- Top socially referred content
- Geographic location of social visitors
Download the Social Media Dashboard
4. Geography Dashboard
Understand where your visitors come from and spot performance issues by region.
Metrics:
- Visits by city, state, continent
- Cities with slow load times

Download the Geography Dashboard
5. Mobile Analytics
Track mobile usage, device types, top mobile pages, and bounce rates.
Metrics:
- Percentage of mobile visitors
- Device types: iPhone, iPad, Android
- Top mobile and tablet content
- Average session duration on mobile
- Bounce rate by device

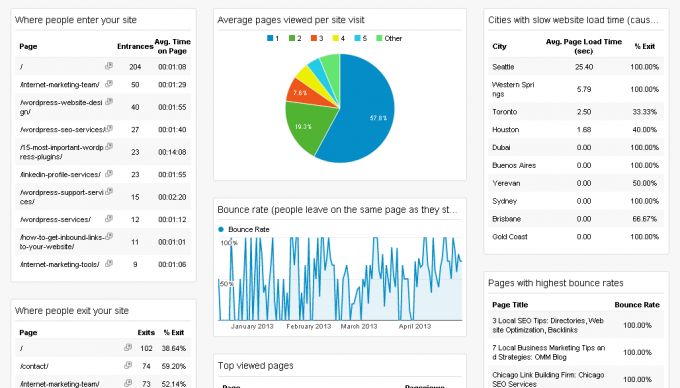
6. Entrances & Exits
Identify where users enter and leave your site to improve navigation and conversion.
Metrics:
- Top entrance pages
- Top exit pages
- Average pages per session
- Bounce rates
- Pages with highest bounce rate
Download the Entrances/Exits Dashboard
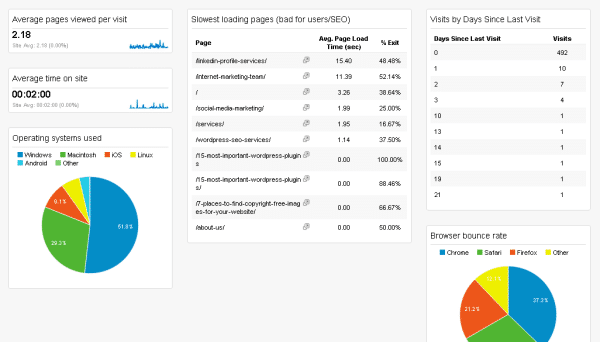
7. Technical Dashboard
Monitor page load times, browser bounce rates, and returning visitor intervals.
Metrics:
- Average page load time
- Slowest pages
- Operating systems used
- Bounce rate by browser
- Average session duration
- Days between visits
Download the Technical Dashboard
Create Your Own Custom Dashboards
To build your own dashboards, log in to Google Analytics and click Customization > Dashboards > New Dashboard. Add widgets with the metrics you need, choosing from charts, tables, or maps.
Frequently Asked Questions
- Where can I find more dashboards? The Google Analytics Solutions Gallery offers hundreds of dashboards, or explore industry blogs for new ideas.
- How do I create widgets? In your dashboard, click Add Widget, select a chart type, choose metrics and dimensions, and save.
- Where are metric definitions? Hover over the question mark next to each metric in the widget editor for a brief description.
If you found these dashboards helpful, please share this guide with your network!